How much are glaciers contributing to sea-level rise?
Melting ice sheets in Greenland and the Antarctic as well as ice melt from glaciers all over the world are causing sea levels to rise. For the IPCC special report on “Ocean and Cryosphere in a Changing Climate“, and AR6 WG-I, an international research team combined glaciological field observations with geodetic satellite measurements – as available from the WGMS – to reconstruct annual mass changes of more than 19’000 glaciers worldwide. This new assessment shows that glaciers alone lost more than 9,000 billion tons of ice between 1961/62 and 2015/16, raising water levels by 27 millimetres. This global glacier mass loss corresponds to an ice cube with the area of Germany and a thickness of 30 metres. The largest contributors were glaciers in Alaska, followed by the melting ice fields in Patagonia and glaciers in the Arctic regions. Glaciers in the European Alps, the Caucasus mountain range and New Zealand were also subject to significant ice loss; however, due to their relatively small glacierized areas they played only a minor role when it comes to the rising global sea levels.
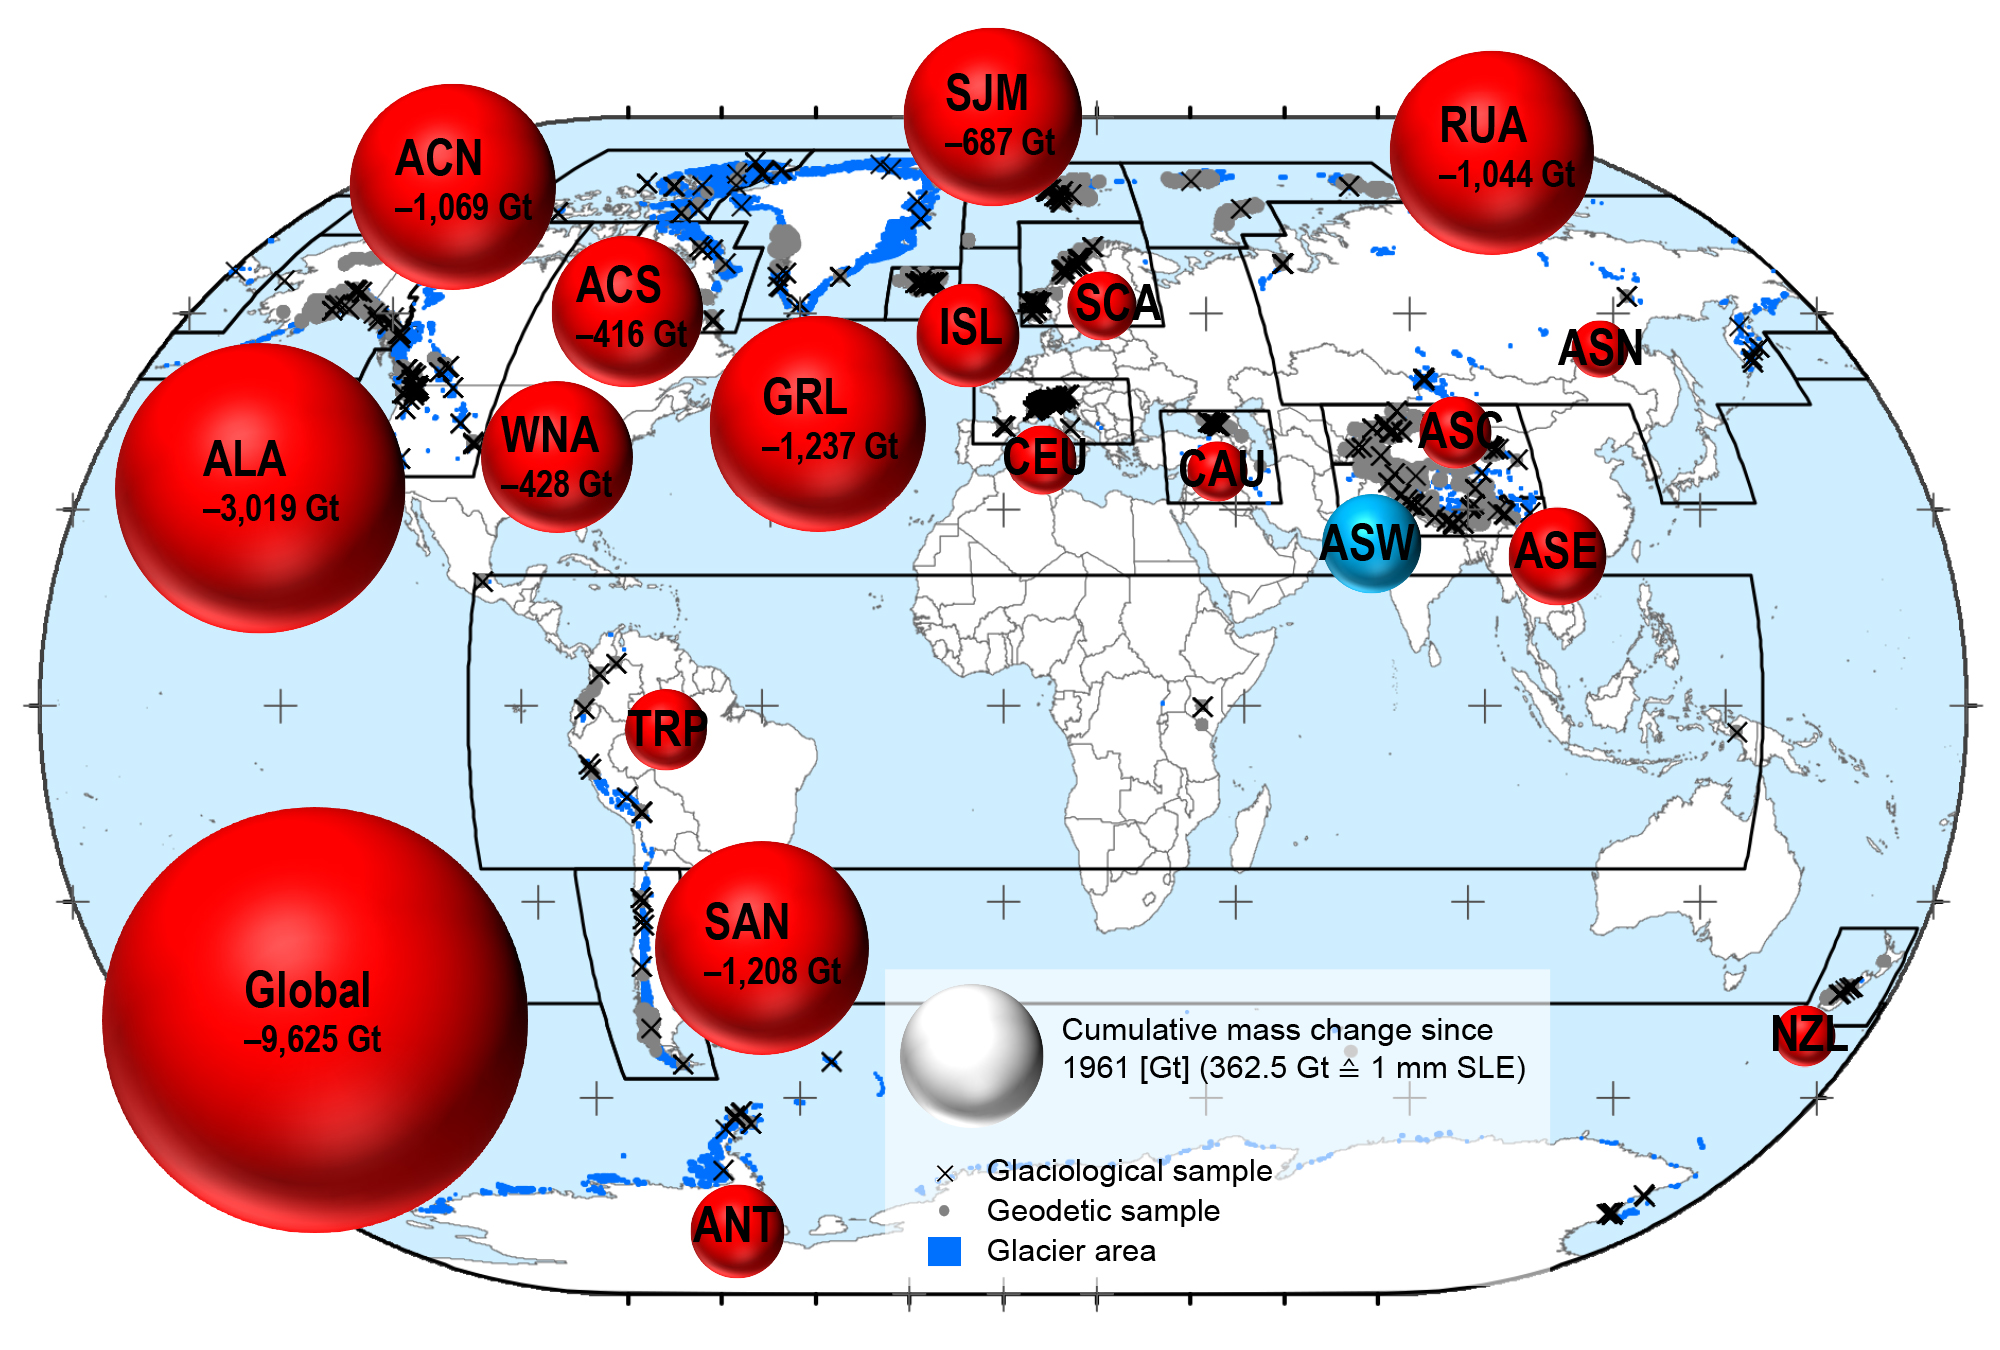
Fig. 1 Regional share of glaciers in sea-level rise from 1961/62 to 2015/16. The cumulative regional and global mass change of glaciers (in gigatons, 1 Gt = 1 000 000 000 tons) corresponds to the volume of the bubbles. Reading example: With more than 3,000 Gt, glaciers in Alaska (ALA) contributed the most to the increase in sea levels. The glaciers in South West Asia (ASW, blue bubble) were the only ones to increase in mass. Source: adjusted from Zemp et al. (2019).
The global mass loss of glacier ice has increased significantly in the last 30 years and amounted to 335 billion tons of lost ice per year during the period from 2006-2016. This corresponds to an increase in sea levels of almost 1 millimetre per year. The melted ice of glaciers therefore accounts for 25 to 30 percent of the currently observed increase in global sea levels. This ice loss of all glaciers roughly corresponds to the mass loss of Greenland’s Ice Sheet, and clearly exceeds that of the Antarctic.

Fig. 2 Global glacier contributions to sea-level rise from 1961/62 to 2022/23. Annual mass changes (left y axis) and global sea-level equivalents (right y axis) are shown with related error bars (indicated by shadings) corresponding to 95% confidence intervals. The ad hoc estimates (orange), based on the glaciological sample and calibrated with regional geodetic estimates from IPCC AR6 (IPCC 2021), are shown with annual values by Zemp et al. (blue; 2019). Source: adjusted and updated from Zemp et al. (2020).
For the most recent years, global glacier mass changes are estimated from regional ad hoc estimates, which are based on a simple approach by Zemp et al. (2020) to assess and correct for the bias in the glaciological sample with respect to the total glacier cover. Thereto, regional geodetic estimates from IPCC AR6 (IPCC 2021) were used for the calibration of the glaciological data. The ad hoc estimates (orange) correct for the slightly too negative glaciological estimates (blue) thanks to the much better global coverage of the geodetic estimates by Hugonnet et al. (2021), included in IPCC AR6.
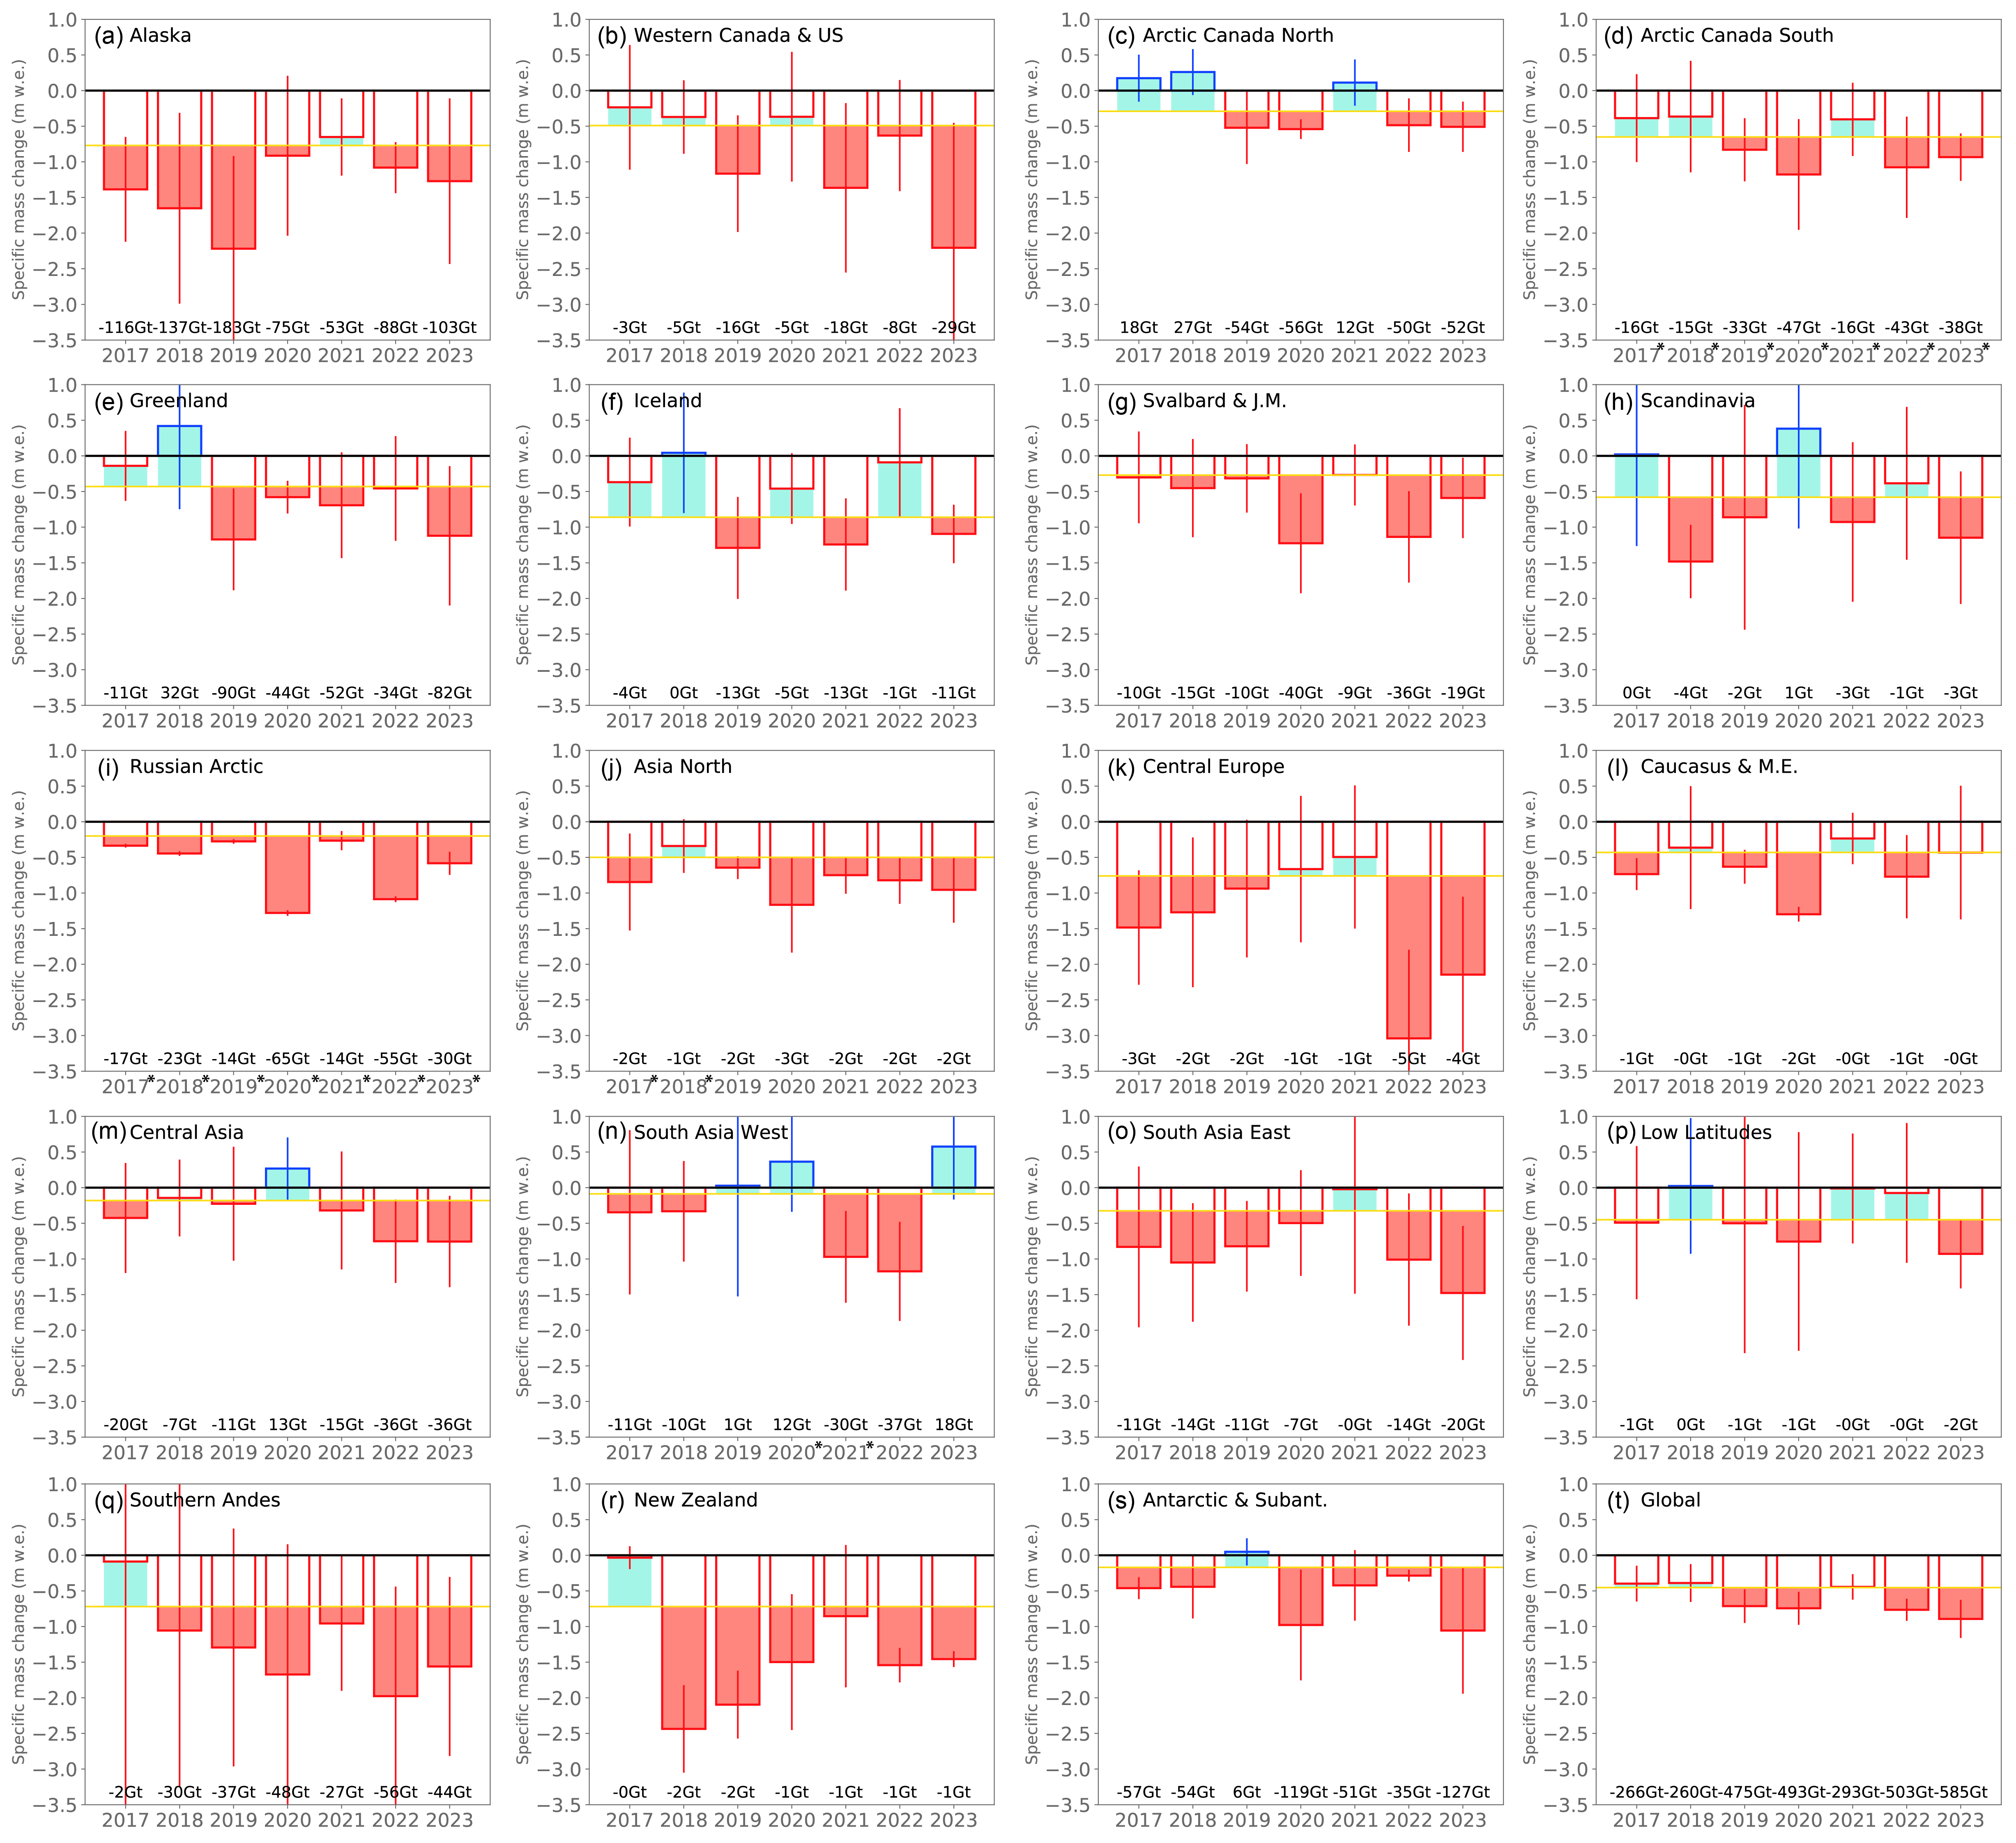
Fig. 3 Ad hoc estimates of regional mass changes in 2016/17–2022/23. The regional (a–s) and global (t) bar plots show the annual specific mass changes (in m w.e.) with related error bars (indicating 95% confidence intervals), with positive and negative values in blue and red, respectively. The golden line indicates the annual mass-change rate of the reference data (in m w.e. per year; IPCC AR6) over the calibration period (2000/01–2015/16). Positive and negative annual mass-change anomalies (with respect to reference data and calibration period) are indicated in pale blue and pale red, respectively. The black values (bottom) indicate annual mass changes in gigatonnes. For regions and years with no glaciological observations (*), complementary data series from neighbouring regions were used. Source: adjusted and updated from Zemp et al. (2020).
Improvements in global glacier mass-change assessment are still possible and necessary. As such, the observational database needs to be extended in both space and time. Here, the most urgent need for closing observational gaps being in regions where glaciers dominate runoff during warm/dry seasons, such as in the tropical Andes and in Central Asia, and in regions that dominate the glacier contribution to future sea-level rise, that is, Alaska, Arctic Canada, the Russian Arctic, and peripheral glaciers in Greenland and Antarctica. A recent assessment has achieved almost global coverage by geodetic observations from differencing of digital elevation models from optical sensors (Hugonnet et al. 2021). This global coverage and an improved approach to combine glaciological and geodetic observations has allowed to produce an operational global gridded product of glacier mass changes (Dussaillant et al. 2023), which is distributed through the Climate Data Store of the Copernicus Climate Change Service. In regions with large glacier covers, the present estimates can be complemented with estimates from spaceborne gravity and altimetry observations (Gardner et al. 2013, Wouters et al. 2019, Jakob et al. 2021). A community effort to reconcile regional and global glacier contributions to sea-level rise from different observational sources is currently under way within the ESA-funded Glacier Mass Balance Intercomparison Exercise (GlaMBIE).
References
Dussaillant, I., Bannwart, J., Paul, F. and Zemp, M. (2023): Glacier mass change global gridded data from 1976 to present derived from the Fluctuations of Glaciers Database. World Glacier Monitoring Service, https://doi.org/10.24381/cds.ba597449
Gardner, A. S., Moholdt, G., Cogley, J. G., Wouters, B., Arendt, A. A., Wahr, J., Berthier, E., Hock, R., Pfeffer, W. T., Kaser, G., Ligtenberg, S. R. M., Bolch, T., Sharp, M. J., Hagen, J.-O. O., van den Broeke, M. R. and Paul, F. (2013): A Reconciled Estimate of Glacier Contributions to Sea Level Rise: 2003 to 2009, Science, 340(6134), 852–857, doi:10.1126/science.1234532.
Hugonnet, R., McNabb, R., Berthier, E., Menounos, B., Nuth, C., Girod, L., Farinotti, F., Huss, M., Dussaillant, I., Brun, F., and Kääb, A. (2021): Accelerated global glacier mass loss in the early twenty-first century. Nature 592 (7856), 726-731. doi:10.1038/s41586-021-03436-z.
IPCC (2021): Climate Change 2021: The Physical Science Basis. Contribution of Working Group I to the Sixth Assessment Report of the Intergovernmental Panel on Climate Change, Cambridge University Press, Cambridge, UK. [online] Available from: https://www.ipcc.ch/report/ar6/wg1/.
Jakob, L., Gourmelen, N., Ewart, M. and Plummer, S. (2021): Spatially and temporally resolved ice loss in High Mountain Asia and the Gulf of Alaska observed by CryoSat-2 swath altimetry between 2010 and 2019. The Cryosphere 15 (4), 1845-1862. doi:10.5194/tc-15-1845-2021.
Wouters, B., Gardner, A.S., and Moholdt, G. (2019): Global Glacier Mass Loss During the GRACE Satellite Mission (2002-2016). Front. Earth Sci., doi.org/10.3389/feart.2019.00096.
Zemp, M., Huss, M., Thibert, E., Eckert, N., McNabb, R., Huber, J., Barandun, M., Machguth, H., Nussbaumer, S.U., Gärtner-Roer, I., Thomson, L., Paul, F., Maussion, F., Kutuzov, S., and Cogley, J.G. (2019): Global glacier mass changes and their contributions to sea-level rise from 1961 to 2016. Nature, doi.org/10.1038/s41586-019-1071-0.
Zemp, M., Huss, M., Eckert, N., Thibert, E., Paul, F., Nussbaumer, S.U., and Gärtner-Roer, I. (2020): Brief communication: Ad hoc estimation of glacier contributions to sea-level rise from latest glaciological observations. The Cryosphere, 14, 1043-1050, doi.org/10.5194/tc-14-1043-2020.